Q1 2017 Performance Report

For most clients, I provide detailed performance reports quarterly – anything more frequent is subject to too much volatility, but on the other hand most people like to see how everything is performing more often once or twice a year.  Quarterly feels about right.

As a new business, I have set up a benchmark portfolio, which I will also track and report on quarterly.  While this portfolio will not match any client’s portfolio exactly, it does provide an indication of how the Nest Egg Investments Investment Principles play out in the real world.

The benchmark portfolio falls into the growth category of portfolios (typically suitable for investors with a timeframe of 8+ years), and consists of:

65% growth assets:

  • Australasian shares 19%
  • Global shares 33%
  • Emerging markets shares 6%
  • Commercial property 7%

35% defensive assets:

  • NZ fixed interest 15%
  • Global fixed interest 15%
  • Cash 5%

Within the above allocations are a mix of passive funds (very low fees, track an index), structured passive funds (similar, but overweight in particular attributes, eg. value stocks or small cap stocks), and carefully chosen actively managed funds.  There are 9 funds used in total, plus term deposits for NZ fixed interest, plus cash.

The results for the first quarter of 2017 (1-31 March), in NZ$, after all fees (fund fees, platform fees, adviser fees) but before tax are as follows:

  • Australasian shares: +8.0%
  • Global shares: +7.1%
  • Emerging markets shares: +12.6%
  • Commercial property: +2.0%
  • NZ Fixed interest: +0.8%
  • Global fixed interest: +1.1%
  • Cash: +0.2%
  • Overall portfolio: +5.3%

This is an excellent result for just one quarter, with all sectors positive, and certainly reflects a good start to the year for equity markets worldwide, plus a weaker NZ$ (which helps performance).  Emerging markets was the stand out performer (see my earlier blog The case for Emerging Markets).  The actively managed funds in the benchmark portfolio overall outperformed the passive/structured passive funds by about 10%.

Its important to note that this is a theoretical portfolio, and the performance will not always look this good.  Still it is a great start!  I will report again after Q2.


Dean Edwards


Fund manager insights

This week I attended an investment conference where a number of fund managers presented on their funds.  While of course there was an element of salesmanship in the presentations (each manager made a compelling case why investors should choose their fund), I thought I would note some of the insights and observations that came from the presentations.

In no particular order, fund manager observations:

  • The outlook for NZ equities:  Risky.  NZ equities have been driven up by the quest for yield and the growth in ETFs (passive, index tracking funds).  Witness foreign ownership of NZ equities which has risen from ~30% in 2012 to over 50% currently.  Watch out if US long term interest rates go over 3%; investors will no longer own equities for income.  The solution: look for value stocks and those with pricing power.
  • Australian equities:  Expensive.  Currently there is a historically wide gap when comparing market prices to earnings/dividend yields.  Contrarian investing is essential (but its not easy to do).
  • The case for global equities (excluding US): Little correlation between NZ economy and global equities, therefore necessary for risk mitigation.  Over the last 7 years, US returns have averaged 12% pa v rest of world 4% pa.  Look for this to swing around.  US$ at 15 year highs, unlikely to go much higher.  There is a wide opportunity set.  Look for owner operated businesses (skin in the game) and those with real competitive advantages.
  • Investing in global infrastructure: Interest rates are likely to rise; historically 2/3 driven by inflation.  What does this mean for infrastructure businesses?  Overall negative, as investors may seek yield elsewhere.  But positive for infrastructure businesses where the cost base is mostly fixed, but where they have the ability to increase prices with inflation.  The trick is to find these infrastructure companies – good sectors are toll road companies, airports, CPI linked businesses.
  • The case for investing in AREITs (Australasian commercial property funds):  This sector will be fuelled by Asian growth – population growth, urbanisation, growth in middle classes.  Will drive demand for commercial property across the region, including Australia & NZ.
  • Natural resources stocks:  Low correlation with other equity market sectors – diversification benefits.  Commodity prices have recovered, but expected to keep increasing, supported by supply constraints caused by low capex spending.  Electric vehicles, batteries expected to drive growth in lithium, copper resources.  Aggregate (stone chips) another growth area.
  • The case for India:  In 10 years, India’s economy will be 3rd largest in world.  Inflation is under control.  Regulatory environment improving.  Household debt is low and education levels/living standards are improving.  Currently penetration of consumer goods is low.  India is also a domestic driven economy – largely immune from global shocks.
  • The case for downside protection:  The environment for equities worldwide has deteriorated: increased political risks, interest rates rising, profit margins falling, declining globalisation, less favourable demographics.  Holding both long and short positions can insulate against market turbulence.  Less upside in rising markets, but provides downside protection in falling markets.

 And finally, please note that none of the above constitutes investment advice or should be considered as recommendations – just interesting observations from a diverse collection of fund managers.

Dean Edwards


Retirement Villages

Like me, you may have noticed retirement villages popping up everywhere around Auckland – there are now 3 within about 1km of where I live (yes, it’s a pretty exciting suburb!)

The surge in retirement villages reflects a couple of things:

Firstly, the number of people over 65 is increasing, and has been for some time as baby boomers get older.  This will accelerate over coming years; today there are around 800k over 65s, but this will grow to about 1.1m by 2050. 

Secondly, retirement village living is proving extremely popular.  There are many advantages of living in retirement villages including:

  • Improved social interaction and activities
  • Easy access to medical support
  • Better security
  • Freeing up of capital from downsizing
  • Smaller house to maintain/less time spent on chores

Many people living in retirement villages report it’s the best move they ever made, and they wish they had moved in earlier!

However, from a financial perspective, the decision to move into a retirement village is not trivial.

The most common financial structure for retirement villages involves:

(1) An up-front capital cost to purchase a right to occupy a unit (but not a freehold title), some of which is returned upon leaving/resale of the unit (note this is often when you die).

(2) An ongoing weekly fee to cover the operating costs of the village.  This will include rates and building insurance but some other costs such as telephone/internet, power and contents insurance are typically not covered by the weekly fee.

(3) A deferred management/amenities fee which is usually calculated as a percentage of the up-front capital cost.  It may be as high as 30%, and is deducted from the capital to be returned when you leave (this will be returned to your estate if you die).

Importantly, residents under the above structure will not get any benefit from the value of their unit increasing during the time they are in the village.  Also, entering a retirement village is often a one-way street – the costs of changing your mind and leaving can be very high.

For those looking at retirement villages, there may be other options worth considering.  For example, for people who don’t like the idea of a retirement village but are finding it harder to manage at home, in home care/assistance could be an option, funded either by a reverse mortgage, or by releasing capital through downsizing to a smaller property.  The advantage of this approach is that you retain full ownership of your property and you (or your estate) will benefit from any future capital gains.

Retirement villages are a growth success story that shows no sign of abating.  Moving into a retirement village could be a great decision, but it’s important to consider the alternatives, ask lots of “what if” questions (you could use this checklist), and get good financial and legal advice at the outset.


Dean Edwards


Portfolio Rebalancing

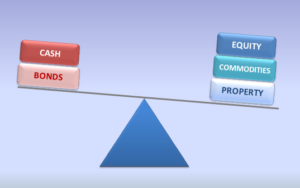
When an investment portfolio is created, it is (or should be) based on the risk appetite and return requirements for that particular investor.  For example, an investor approaching retirement may settle on a balanced portfolio of 50% growth assets (equities and property) and 50% defensive assets (bonds, fixed interest and cash) likely to generate mid-range returns with mid range volatility – an appropriate strategy for their personal situation.

However, over time the actual mix of the investor’s assets might stray significantly from their target allocations.  Typically this happens as the value of equities and property grows faster than the value of bonds, fixed interest and cash, although it can go the other way too (for example in 2008 when equities all around the world plummeted by 40-50%).

There are two dangerous scenarios when asset allocations move significantly from their targets:

When growth assets exceed the target allocation, the portfolio is likely to experience more volatility than was planned for.  This can be highly unsettling for investors, particularly when that extra volatility is in the form of a big downward swing in the value of their portfolio!  And it can be risky too.  Depending on the investor’s life circumstances, there may not be enough time to recover from negative falls to their portfolio.

The opposite scenario also has downsides.  If defensive assets exceed their target allocation (often due to a significant downturn or collapse in equities and/or property), then the returns from the portfolio over the long term are likely to be lower than for an on-target portfolio.  This is due to having less growth assets in the portfolio; growth assets should exceed returns from defensive assets over time (but with more volatility).

So to mitigate against these negative scenarios, the solution is to rebalance the portfolio when it strays from its target allocation – if necessary by selling down one asset class, and buying another to return the portfolio to its target allocations.

But how?

There are many different rebalancing strategies.  Most are time based (eg. quarterly or annual rebalancing) or threshold based (eg. if assets stray by more than 5% or 10% from their targets), or a combination of the two.

But too frequent rebalancing can be counter-productive, as there are usually costs to rebalance – brokerage costs or bid/ask spreads for buying or selling.

My approach is to use percentage thresholds to trigger a rebalancing signal, and then apply investment wisdom to make final rebalancing decisions.  Those decisions may include:

  • Hold fire if it seems an asset class is in the middle of a strong upward (or downward) run
  • Use portfolio cash flow (new contributions, dividends, interest payments) to fund rebalancing wherever possible
  • If selling, make decisions on the particular shares, funds, bonds or properties within that asset class to sell down
  • Same as above if buying.

Rebalancing will keep a portfolio on track from a risk (in particular) and return perspective.  If done effectively, it’s also a mechanism for achieving the investment holy grail of buying low and selling high.


Dean Edwards


How much is enough?

Thinking about retirement?  How much do you need to fund the retirement you would like? 

If you Google “retirement calculator” you will see there is no shortage of online tools to help work out how much money you need to fund your retirement.  However most of the resources available assume an all or nothing retirement, ie working fulltime until age 65 (or some other specified age) and then never working again. 

In reality, this is becoming less and less common.   For many people, while they do reach a point where they want to scale back, they often don’t want to completely stop working.  In fact they would find a total and abrupt retirement quite daunting, and probably rather boring too.  They like their job and enjoy the social interaction, sense of purpose and challenge that comes from working – as well as the income. 

Part time work, or even periods of working then not working, are becoming increasingly common retirement situations; the traditional view of stopping work altogether at a certain age, never to work again, less so.

This more fluid approach to retirement adds further complexity to an already hard-to-answer question: how much money is enough to fund your retirement (whatever that looks like)?  

Amongst the factors that need to be considered are income streams (from working or elsewhere), future investment returns and volatility, inflation, tax, NZ Super, how long you are likely to live, different spending requirements at different stages of retirement, inheritance wishes, etc.

Unfortunately most of the online tools available to help are not flexible enough to deal with a modern retirement that may include some irregular periods of income, one off costs, and changes in spending requirements at different stages of retirement. 

My approach is to build a year by year financial model, starting from your current age, until an estimated year of death, factoring in all the things you know or believe about your retirement – income and costs, as well as assumptions around investment returns, tax, inflation, NZ Super, inheritances, etc.  And then treat this as a living model, to be revisited at least each year, or whenever circumstances or views of your retirement change (as they surely will). 

The model will show how much you need to fund your retirement, and how much you need to save/invest to get there.  It’s also very easy to change assumptions and inputs to see what the impacts are.  For example, you may see that saving and investing 10% more/year will allow you to start your retirement 5 years earlier.  Or by working part time for 3 years after your planned retirement age you can increase the amount you spend in retirement by $5k/year. 

Knowledge is power (and peace of mind)!  For most people, comprehensive retirement planning done early and revisited often is a very valuable exercise.


Dean Edwards


The case for Emerging Markets

Emerging Markets are currently a hot topic in investment circles.  After several of years of negative performance, Emerging Markets bounced back to life in 2016 and many are picking the strong performance to continue in 2017 and beyond.

But first, what exactly are Emerging Markets?  There isn’t a clean definition, but generally the term describes a set of countries which display low per capita GDP, high economic growth rates, and financial systems that are not as far advanced as in developed markets (North America, Western Europe, Australasia). 

The 10 largest Emerging Market countries are in order: China, South Korea, Taiwan, India, Brazil, Russia, South Africa, Mexico, Malaysia and Indonesia.  And don’t think Emerging Markets only consist of small, unknown, risky businesses.  They do(!) but they also include some giant, well known global companies such as Samsung, Alibaba and Infosys to name a few.

All up, Emerging Markets account for around 12% of global equity market capitalisation and this, coupled with the high growth rates, presents a strong case for inclusion in a globally diversified investment portfolio. 

The positives for investing in Emerging Markets can be summed up as a combination of strong demographic trends (particularly a burgeoning middle class), generally low debt ratios, and cheap company valuations.  The biggest risk factors include the uncertain impacts of Trump administration policies (his rush to build his wall is already hurting the Mexican economy), and in-country and in-region turbulence which is always difficult to predict.

Investing in Emerging Markets is not for the faint hearted.  The characteristics that make markets fall into the emerging category also lend themselves to high volatility.  There have been major surges and declines in the past, and this is most likely to continue in the future!  I would recommend investing in emerging markets only for those with a long term investment horizon (10 years plus), and who can stomach the ups and downs along the way. 

My preferred method of accessing Emerging Markets is generally a mix (for diversity) of dedicated, low cost index tracking funds, plus using specialised Emerging Market investment funds.  Index funds will capture the growth of the sector as a whole, and dedicated fund managers may be able to overweight in countries, industries and companies which will out-perform (the cost being a higher management fee).

Emerging Markets overall increased 10% in 2016, following negative returns in 2013, 2014 and 2015 of -2%, -2% and -14% respectively.  In the last 10 years, annual returns have been as low as -53% (2008) and as high as +79% (the year after, in 2009). 

The message for Emerging Market investors: buckle up!


Dean Edwards


What’s in store for 2017?

Well, after a couple of weeks of camping, beach, BBQs, and watching too much tennis & cricket, its time to get back to thinking full time about investing. 

Actually I never fully disengage; I’m always watching what is happening with investment markets (unless I’m fully off grid with no wifi, which does happen from time to time!).

Fortunately, my summer break has coincided with a very healthy start to 2017 for equities, with most investment markets surging forwards over the New Year, and clients seeing a healthy growth in their portfolio values in a very short space of time.

Which actually nicely highlights one of the investment principles I hold most dear.  Markets do tend to surge, often unexpectedly, and its important to be invested in the market to get the benefits of days when the surges to occur. 

A 2014 US study by JP Morgan Asset Management illustrates this nicely:

An investor staying fully invested in the S&P 500 from 1993 to 2013 would have had a 9.2% annualized return.

However, if they missed just the ten best days during that 10 year period, then those annualized returns would collapse to 5.4%.

The obvious message here is to stay invested.  Missing out on some of the best surge days will seriously reduce your returns.

OK, so what are the prospects for 2017?

Looking at a variety of sources, my one line assessment for the investment prospects of major asset classes over the short term (ie the next few months) are:

NZ equities:  Neutral.  Strong economic growth, but reasonably high company valuations.

Australia equities:  Neutral.  Economy rebalancing continues away from mining, but valuations are reasonable.

US equities:  Neutral.  Trump administration policies will boost growth prospects, but company valuations are at elevated levels.

Asia equities:  Positive.  China economic reform continues, strong growth prospects for Japan.

European equities:  Neutral-negative.  Uncertainties over Brexit, upcoming elections & future US trade policies.

Emerging market equities:  Positive.  Economic reforms and low valuations.

Bonds:  Negative.  Rising global interest rates and higher inflation likely to negatively impact bond valuations short term.

Commercial property:  Neutral.  Solid property fundamentals, but countered by increasing interest rates.

All up, the investment market outlook for the short term is OK; not stellar but also not terrible.  Let’s see what actually transpires!


Dean Edwards


A week in politics

A week is a long time in politics. That has definitely been the case in NZ, with a new PM Bill English and deputy PM Paula Bennett installed following John Key’s shock announcement to step down.  The days after Key’s announcement saw excitement amongst opposition parties as they recalibrated upwards their chances of success next year, and also revealed some previously unseen divisions in the National party caucus, as the major contenders for leadership roles (at least in their own eyes) jockeyed for position.

But in the end it was a swift and uncontested coronation for both English and Bennett, with Stephen Joyce picking up the role of Finance Minister.  On the economic front, we can expect a continuation of current policies without too many major changes.  However, the new leadership role provides English a timely opportunity before next year’s election to refresh his cabinet ministers, and cull under-performers.  Watch to see the winners and losers over the next couple of weeks.  

In his former role of Finance Minister, English also delivered last week’s half yearly fiscal and economic update.  This generally painted a positive picture for the NZ economy going forwards.  Of particular interest was the forecast of increasing budget surpluses over coming years – even after absorbing the costs of the Kaikoura earthquake – which provides the government with interesting options: increase social spending and/or reduce taxes.  The next budget should be interesting.

The economic update also forecast capital spending to climb from $900m this year to $3 billion next year, and over $2 billion in years thereafter.  Expect the bulk of this spending to be in areas like education, defence, and housing, with a priority being measures to accommodate NZs surging population, which increased by 70k in 2016, with further strong immigration-led population growth forecast for future years.

A growing population certainly helps to underpin the forecasts for GDP growth of around 3% per annum to 2020 (one of the strongest in the developed world).  But large inward migration also creates challenges in assimilating new arrivals, and the accompanying social tensions.  Expect to see immigration as a hot election topic in 2017.

On the housing front, there are two conflicting forces at play.  On one side, a growing population will require housing and place further pressure on supply.  Countering this, expect to see increases in mortgage rates in 2017 as global (and NZ) interest rates increase.  For property investors, if mortgage repayments exceed rental income, some (maybe many) may exit the market, and reduce housing demand.  It’s difficult to predict with any confidence the net impact of these opposing forces on house prices, but my gut feeling is that a sustained period of flat house price growth is the most likely scenario.  Expect housing affordability to be another hot election topic next year.

With an election looming, new National Party leadership, a reinvigorated opposition, budget surpluses available, and big issues like immigration and housing affordability, 2017 is shaping up to be a fascinating year in politics!


Dean Edwards


Investing your windfall

lump-sum

Sometimes the planets align and through good fortune or good management you receive a large sum of money.  If you choose to invest your windfall, what is the best approach to take?  Invest all at once, or make smaller investments regularly over a period of time – say each month for 12 months? 

Spreading investments out equally over time takes advantage of dollar cost averaging.  Dollar cost averaging means that you buy fewer units when markets are high, and more units when markets are low.  This results in your average cost (total cost/total number of units) being less than the average cost of the units.  Try it out in a spreadsheet if you don’t believe me!  It’s a great approach if you’re investing regularly (say a portion of your salary each month), but how does it stack up v having a lump sum available to invest on day 1?

Vanguard, the giant US investment group who manage over $4 trillion(!) in assets, carried out some extensive research on this topic, looking at the difference between lump sum investing and dollar cost averaging.  The research covered three markets (USA, UK, Australia), different investment mixes (ranging between 100% equities and 100% bonds), and different periods for the dollar cost averaging strategy (from 6 to 36 months).  And then the results were compared for investment durations of between 5 and 30 years, and across rolling periods from 1926 to 2012.  In other words, it was a pretty comprehensive study!

The results showed that making a lump sum investment will result in higher returns compared with dollar cost averaging around two thirds of the time.  The outcomes were also remarkably consistent across markets, investment mixes, dollar cost averaging periods, and investment timeframes.  Where dollar cost averaging does come out ahead is in situations where a lump sum investment is made just prior to a significant market downturn – ie worse case scenarios.   

If you do have a lump sum to invest, my advice is aligned with the findings of the research.   It’s very hard to predict when markets will surge or tumble, so the wisest move is usually to invest immediately, and gain exposure to the markets as soon as possible, for as long as possible.  It doesn’t guarantee the best outcome, but it does put the odds firmly in your favour.


Dean Edwards


PS. If you are interested in the Vanguard study, you can find it here.


Simplicity KiwiSaver changing the game

simplicity-kiwisaver-800x463

This week I had the opportunity to sit down with Sam Stubbs, Managing Director of Simplicity NZ Ltd, who 10 weeks ago launched the Simplicity KiwiSaver Scheme.  Simplicity has generated quite some attention in its short 10 week life – and for good reason.  This is a KiwiSaver scheme that I believe will shake up the industry for the better.  Why?  Because Simplicity charge fees that are significantly lower than all other KiwiSaver providers.

Simplicity point out that KiwiSaver fees – typically fixed admin charges plus percentage-of-fund management fees – are often well disguised by existing KiwiSaver providers, who usually report on the admin charges as a $ figure, but (conveniently) report the more significant management fees as a percentage.

Proposed new KiwiSaver reporting rules will require all KiwiSaver fees to be reported as a $ amount from next year.  However, the NZ Bankers Association is pushing back on this, pleading the high system complexity for banks to change the way they report fees (really?).  Surprise, surprise, banks are the biggest KiwiSaver players with over 80% market share.

Simplicity keep their fees low by investing internationally via low-cost passive funds (they use Vanguard ETFs), and with direct investments in NZ due to the lack of low-cost index funds.  They are online only, have low staffing overheads, and avoid advertising and commissions.  Furthermore, they are structured as a not-for-profit KiwiSaver plan and will donate 15% of annual management fees to charity.

The very credible example that Simplicity use shows that an average-wage KiwiSaver investor contributing 3% for 45 years will be $65k or 20% better off in a the Simplicity Growth fund v an industry average growth fund, based on the fee savings (and growth on those savings).  There are of course a number of assumptions behind this, but it’s hard to argue with this sort of advantage built upon lower fees.

I like Simplicity.  I like the low fees.  I like the transparency.  I look forward to seeing how they shake up the all-too-comfortable KiwiSaver industry.


Dean Edwards

(Nest Egg Investments is 100% independent and does not receive commissions or payments from product providers)